

- Monthly visits
- 0
- Pricing
- Free & Paid
- Listed
- 2025-12-12
- Updated
- 2026-08-25
01Product Positioning
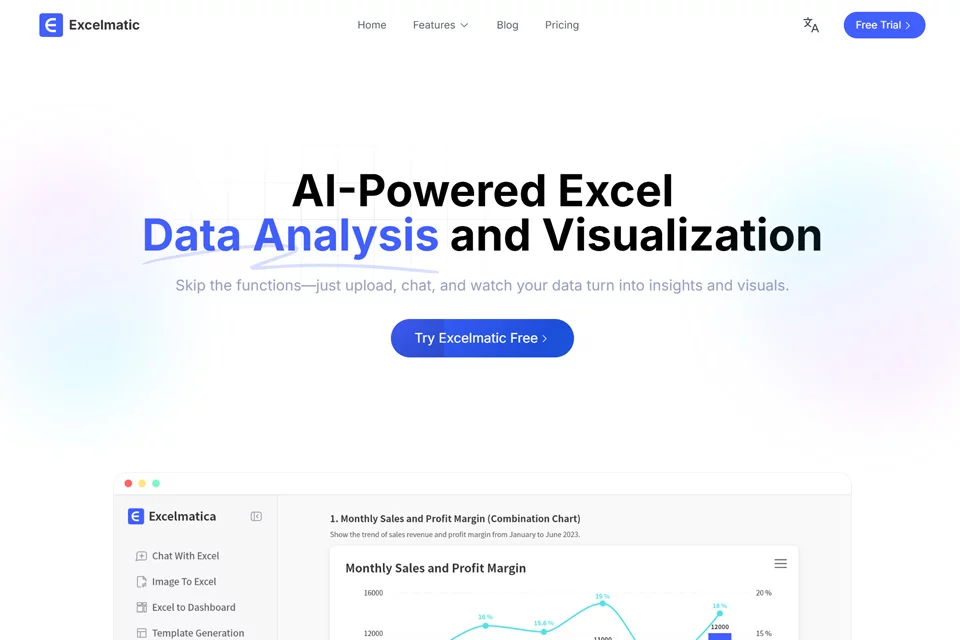
Excelmatic is an AI office tool focused on spreadsheet data processing. After uploading an Excel or CSV file, users can describe questions or calculation needs in natural language to receive data query results, charts, or formula suggestions.
It brings data import, organization, analysis, and presentation into a single workflow. It is suitable for data users who are unfamiliar with complex functions or programming, and can also reduce the time analysts spend on repetitive spreadsheet tasks.
02Key Features
The tool supports natural-language queries for Excel and CSV data. Based on user descriptions, it can generate charts and Excel formulas and handle common data issues such as duplicate values, missing values, and formatting errors.
Excelmatic also provides trend analysis, anomaly detection, and multidimensional data viewing. It can convert paper tables or screenshots into editable Excel files. Results may be affected by the structure of the original data, field names, and image clarity.
03Use Cases
Business users can use it to quickly review sales, marketing, or human resources data and generate basic reports and trend charts. Managers can use organized data to understand business changes.
Data analysts can delegate repetitive data cleaning and preprocessing to the tool before conducting further analysis. Researchers and students can use it for preliminary statistics and charting of experimental data. It has a relatively low barrier to entry for users who frequently work with spreadsheets but are unfamiliar with formulas or code.
04Usage Considerations
Natural-language analysis is not a substitute for manual review. Before using the tool, check column names, data types, missing values, and time ranges to avoid biased results caused by an improperly structured source spreadsheet.
Automatically generated formulas, charts, anomaly assessments, and image-to-spreadsheet results should all be verified before delivery or decision-making. For important business or research conclusions, retain the original file and independently validate key calculations.
© Disclaimer: domains and linked content may change over time. AIEZZ does not control third-party websites. Review external content and risks independently.
User reviews0