

- Monthly visits
- 0
- Pricing
- Free & Paid
- Listed
- 2025-12-30
- Updated
- 2026-08-25
01Product Positioning
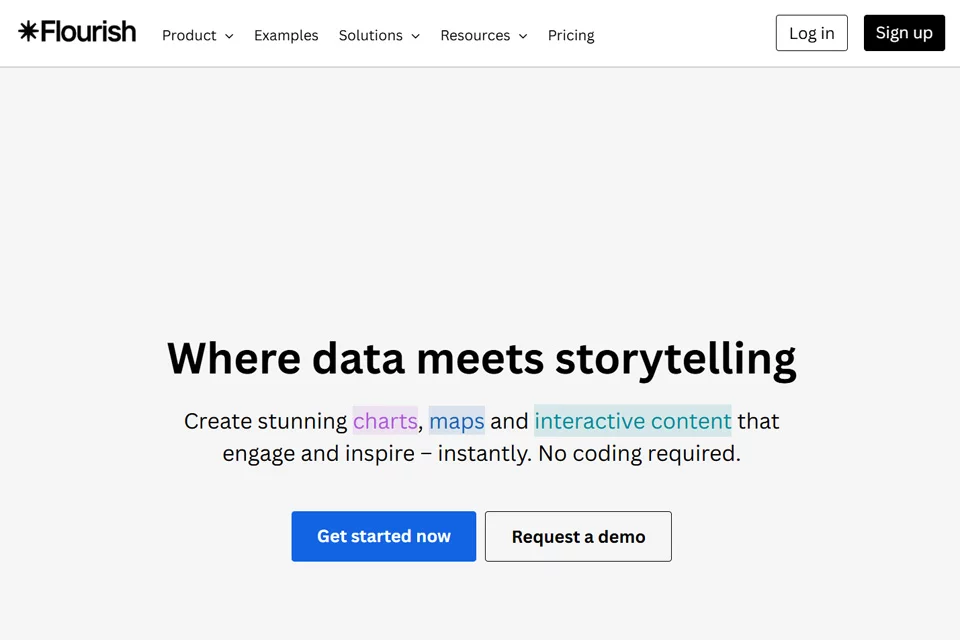
Flourish is an online data visualization tool designed to make spreadsheet data easier to present clearly. It requires no coding and is suitable for students, presenters, and content creators who want to make interactive charts quickly.
Users can start with a data table, choose a suitable template, and organize information interactively to create charts or narrative pages for display on the web.
02Key Features
The tool supports Excel and CSV uploads and offers a range of visualization templates, including animated bar chart races, Sankey diagrams, network graphs, and 3D maps. Charts can support interactions such as clicking and filtering, as well as scrollytelling that combines multiple charts into a continuous presentation.
Finished projects can be embedded in websites, blogs, and other content pages, and displayed on both desktop and mobile devices. Flourish can also be used with Canva to combine graphic design content with interactive charts.
03Use Cases
Students can use it to present data in academic papers, while workplace users can apply it to quarterly reports, retrospectives, and business presentations. Marketing, operations, and business analysis teams can use templates to quickly show trends, structures, and category relationships.
Data journalists and independent content creators can use dynamic maps, chart races, or scrollytelling to organize their stories. Corporate communications and marketing teams can embed charts in websites or content pages to publish interactive information.
04Things to Consider
Chart quality depends on the structure and format of the source data, so data should be organized and template requirements confirmed before uploading. Since there are many templates and presentation styles, selection should prioritize ease of understanding rather than animation or visual effects alone.
Before publishing, interactive projects should be checked to ensure that filtering, clicking, and scrollytelling work properly, and their readability should be reviewed separately on desktop and mobile devices. Complex data still requires manual decisions about narrative order and annotations; the tool does not automatically replace analytical judgment.
© Disclaimer: domains and linked content may change over time. AIEZZ does not control third-party websites. Review external content and risks independently.
User reviews0