
- Monthly visits
- 0
- Pricing
- Free & Paid
- Listed
- 2026-01-05
- Updated
- 2026-08-25
01Product Positioning
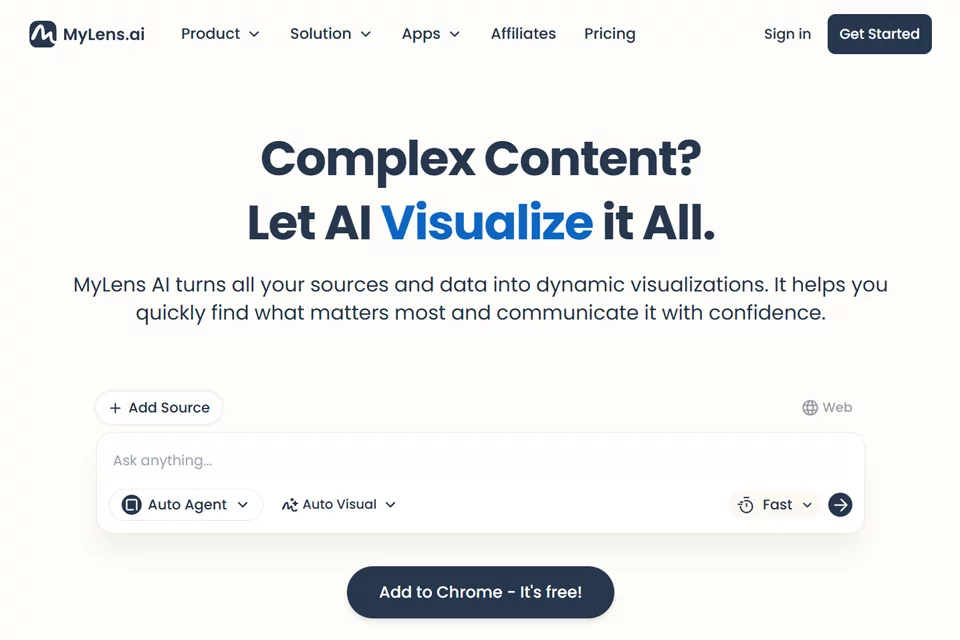
MyLens AI is designed for users who need to process complex materials. Its core purpose is to transform textual information into visual structures that are easier to browse. It does more than provide summaries: based on relationships within the content, it generates mind maps, timelines, flowcharts, four-quadrant charts, and other formats.
The tool is suitable for previewing materials, organizing structures, and supporting knowledge management, helping users establish an overall picture before examining specific content in greater detail.
02Key Features
According to the available product information, MyLens AI supports inputs such as PDFs, Word files, PowerPoint files, long-form text, web links, and YouTube video links. Generated results include mind maps, timelines, flowcharts, and four-quadrant charts, which can be further explored at different information levels in an interactive interface.
Some chart nodes support tracing information back to its original document source, making it easier to verify the content. The materials also mention that users can initiate visual organization while browsing the web through a Chrome extension.
03Use Cases
Research and learning: Use it to initially organize the thematic relationships, development processes, or argument structures of papers, reports, and course materials.
Work and analysis: It is suitable for organizing industry reports, meeting materials, and project documents, helping extract decision-making information and task structures.
Content and teaching: It can convert long web pages, videos, or lesson plans into structured frameworks for topic preparation, course design, and knowledge presentation.
04Usage Considerations
Generated charts depend on the quality and structure of the input materials. Complex, ambiguous, or incomplete materials may require manual adjustment and verification. Source tracing can assist with validation, but it does not mean that generated results are inherently accurate. When dealing with research conclusions, business decisions, or teaching content, users should still consult the original text.
The product uses a free and paid model. The specific feature scope and usage limits should be confirmed based on the information shown on the actual product page.
© Disclaimer: domains and linked content may change over time. AIEZZ does not control third-party websites. Review external content and risks independently.
User reviews0