

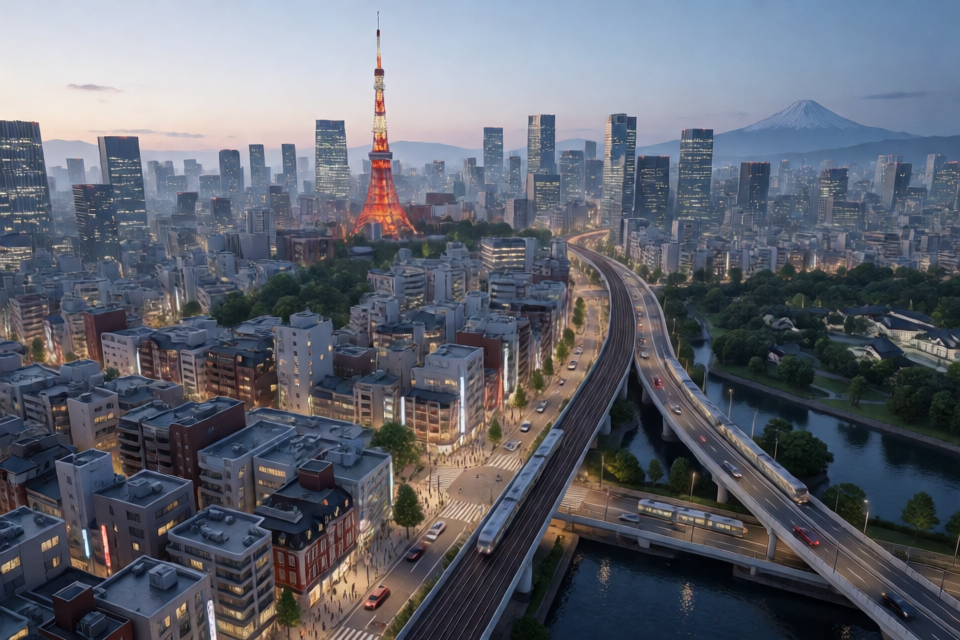
What Is Procedural Tokyo?
Procedural Tokyo is a real-time 3D model of Tokyo that runs in the browser. It combines real buildings, roads, terrain, railways, and geographic features with procedural details such as facades, windows, street furniture, traffic, lighting, water, weather, and birds.
The project uses public data from Project PLATEAU, OpenStreetMap, and the Geospatial Information Authority of Japan. An offline compiler converts the source records into compact binary tiles, while the browser streams and meshes the tiles near the camera.
You can try the hosted version at jeantimex.github.io/tokyo. The experience is designed for desktop browsers and is not recommended for mobile browsers.
Explore the Available Scenes
Each scene covers an area of approximately 3.4 by 2.8 kilometres. The included areas are:
- Tokyo: Tokyo Station, Marunouchi, and the Imperial Palace moats.
- Shiba: Tokyo Tower, Zojo-ji, and Shiba Park.
- Shibuya: The Scramble Crossing, Shibuya Station, and the expressway.
- Shinjuku: Shinjuku Station, the skyscraper district, Kabukicho, and Shinjuku Gyoen.
- Chiyoda: Akihabara, Kanda, and Ochanomizu.
- Chuo: Tsukiji, Kachidoki, Tsukishima, Harumi, waterfront areas, and canals.
- Fujinomiya: A town near Mount Fuji with a 60-kilometre terrain backdrop.
PLATEAU covers hundreds of Japanese cities, although the available level of detail varies. City centres may include detailed roof shapes and aerial photo textures, while smaller towns may use simpler building blocks.
Key Features
Realistic Buildings and Ground
Buildings use real footprints, heights, storeys, and usage information. Where PLATEAU provides detailed shells and roof photography, those assets are used directly. Generated facades, windows, balconies, parapets, rooftop equipment, and shop sign bands add detail at close range.
The ground uses a five-metre elevation model, aerial photography, road surfaces, kerbs, parks, woods, and water. Road markings include lane lines, zebra crossings, stop lines, arrows, Japanese 止まれ markings, and painted speed limits.
Animated City Life
Traffic follows the real road graph, keeps left, observes one-way streets and signals, queues at junctions, and uses expressways and ramps. Trains run along real railway lines. The scene also includes utility poles, wires, street lights, traffic signals, vending machines, torii, station platforms, footbridges, trees, and parked cars.
Time, Weather, and Reflections
A time slider or live Tokyo clock controls the sun, moon, sky, shadows, and exposure. As evening arrives, city lights activate before darkness settles through twilight. The renderer also supports volumetric clouds, atmospheric perspective, rippled water, window reflections, glowing signs, headlights, and Tokyo Tower lighting.
Bird flocks can land in trees and fly away again. In the Fujinomiya scene, an optional coarse terrain backdrop places Mount Fuji behind the town and includes aerial imagery and a snow cap.
Install and Run the Project
Clone the repository and install its dependencies with npm:
npm installDownload the CC0 textures used by the project. This step is required once and stores approximately 14 MB in public/textures/:
node tools/assets/fetch_textures.mjsNext, fetch the raw data for an area. The following example downloads the Tokyo source data:
npm run fetch -- --area=tokyoCompile the downloaded records into browser-ready tiles:
npm run compile -- --area=tokyoFinally, start the development server:
npm run devOpen http://localhost:5280 in a desktop browser. The compiled city files are not committed to the repository, so each area must be rebuilt from its source data.
Understand the Data Pipeline
The pipeline has two main stages. The fetch command downloads source files into data/raw/<area>/ and aerial imagery into public/ortho/<area>/. The compile command converts those records into streamed tiles under public/tiles/<area>/.
Run the complete pipeline for a selected area with:
npm run fetch -- --area=shibuya
npm run compile -- --area=shibuya
Raw downloads can be large because PLATEAU building photography is included. The README lists approximately 3.6 GB for Tokyo, 3.0 GB for Shiba, 1.3 GB for Shibuya, and 0.2 GB for Fujinomiya. Compilation takes from seconds to a few minutes depending on the area.
Inspect and Test Compiled Data
Create a top-down preview of an area with:
npm run preview -- --area=tokyoRun the project's tests to check tile round trips and road-marking clearance:
npm testThese checks are particularly useful for terrain alignment. Road surfaces, lane markings, and symbols are split along the terrain mesh triangles so they remain above sloped ground and do not sink through tile boundaries.
Use the Browser Controls
- Drag to pan.
- Right-drag to rotate.
- Use the mouse wheel to zoom.
- Use
WASDto move. - Hold
Shiftwhile moving for faster travel. - Press
Nto switch between day and night. - Click a building to inspect it.
The Settings panel in the top-right corner lets you switch areas and adjust time, traffic, clouds, lighting, and rendering quality. Settings are saved in the browser.
Open a Scene with URL Parameters
URL parameters are useful for sharing a particular view or testing a rendering configuration. For example:
https://jeantimex.github.io/tokyo/?area=shibuya&time=18.5&traffic=0Supported parameters include:
area=tokyo|shiba|shibuya|shinjuku|chiyoda|chuo|fujinomiyaselects an area.time=18.5sets the Tokyo local hour.night=1switches to night mode.cam=x,z,distance,azimuth,elevationsets the camera.radius=900controls the active view radius.traffic=0disables traffic.cars=600changes the number of cars.birds=150changes the number of birds.clouds=0.25controls cloud coverage.ortho=0disables orthographic mode.
A page opened with URL parameters does not overwrite the saved browser settings.
How the Compiled Tiles Work
The client uses a local metre coordinate system with the origin at the area's centre. The x-axis points east, the y-axis points up, and the z-axis points south. Tiles are 256-metre squares and are meshed in Web Workers while the site streams tiles near the current view.
A compiled area contains the following files:
manifest.jsonstores the origin, bounds, tile list, terrain grid, bridge decks, and attribution.t_<x>_<z>.binstores one tile of buildings, ground surfaces, road paint, props, wires, and signs.terrain.binstores the Float32 terrain height grid at five-metre spacing.roads.jsonstores the road graph, point levels, and signalled junctions.rails.jsonandstructures.jsonstore railway lines, platforms, canopies, and footbridges.backdrop.binstores optional coarse terrain surrounding an area.
Add or Configure an Area
To add another PLATEAU-covered city, define an entry in tools/pipeline/config.mjs. An area specifies a centre point and the PLATEAU grid squares to process. It can also define an optional backdrop size and the opening camera view.
All pipeline scripts accept the same area option:
npm run fetch -- --area=my-area
npm run compile -- --area=my-area
npm run preview -- --area=my-area
PLATEAU files are fetched through the PLATEAU data catalogue API. The pipeline deduplicates records by gml:id, which is important when a Tokyo dataset square appears under more than one ward. Coverage differs between cities, so the client falls back to generated detail when detailed shells, photo textures, or street furniture are unavailable.
Advanced Technical Details
Terrain, Roads, and Bridges
PLATEAU, OpenStreetMap, and GSI data are projected into one local metre grid. A shared five-metre elevation grid gives neighbouring tiles identical heights along their edges. Building bases are checked against the terrain during compilation, and the difference is logged.
Road outlines that lack detail are split into carriageways and sidewalks using OpenStreetMap centrelines. Bridges and flyovers receive separate profiles: street bridges are levelled from bank to bank, expressways are lifted by layer, and ramps are graded to connect correctly.
Lighting and Reflections
Instead of creating a separate dynamic light for every lamp, street lamps and headlights are drawn into a light map. Overlapping sources preserve the brighter value, while lamp height data prevents lights below a flyover from illuminating its deck.
Water reflections draw the city a second time below the water surface. Ripples distort the result, and cloud reflections sample the weather map. Window panes are marked in the colour buffer alpha channel and processed in a screen-space reflection pass.
Rendering and Performance
The renderer uses three.js with the pmndrs postprocessing composer. Its effects include n8ao ambient occlusion, reflections, atmosphere, clouds, bloom, and tone mapping. Birds are positioned in a vertex shader, allowing large flocks to use very little CPU time.
For better performance, keep the active radius moderate, reduce the number of cars and birds, disable clouds, or lower rendering quality in the Settings panel. The default streaming mode loads nearby tiles; the whole city option loads all available tiles and can require considerably more memory.
Deploy the Compiled Site
After compiling the areas you want to publish, run:
npm run deployThis builds the distribution and force-pushes dist/ as a single commit to the gh-pages branch of the repository's origin. The deployment includes whichever cities are compiled on that machine. The README estimates approximately 650 MB for the seven included areas.
Data Attribution and Licensing
The code is released under the MIT License, but the city data remains subject to the terms of its original sources. Project PLATEAU provides the 3D city models, roof photos, bridges, and street furniture. GSI provides elevation data and aerial photography. OpenStreetMap contributors provide roads, railways, and places under the ODbL. Poly Haven textures are CC0, trees use ez-tree under MIT, and atmosphere and cloud components come from three-geospatial under MIT.
Conclusion
Procedural Tokyo demonstrates how public geospatial datasets can become a richly animated browser experience. To work with it, install the dependencies, download textures and area data, compile the data into tiles, and launch the development server. From there, URL parameters, pipeline configuration, tests, and deployment commands provide practical ways to explore and extend the project.