


Whether you're making slides, writing reports, or putting together a paper, the most painful part is rarely the writing—it’s finding and creating the right illustrations.
If the drawing looks ugly, even you can’t stand looking at it. If it’s complicated, every edit breaks something. Download one online, and it either has a watermark or turns into a mosaic when enlarged. So you ask AI to draw one? It gives you a PNG. You take a look: the arrow points the wrong way, and the text is misspelled—and you can’t fix it because it’s just a static image.
Now I’ve found a way around all that: let AI draw directly in Draw.io on your computer.
This isn’t about generating an image for you to view. It actually draws in the diagramming software, one shape at a time. When it’s done, the file is your .drawio file, which you can double-click and edit. Want to export PNG, SVG, or PDF? Go ahead.
AI assists, humans lead. That’s not just a slogan. You really can edit the result.
This approach first appeared on Codex
I first came across a video by Muyang on X. The title was very direct: “Watching Codex draw diagrams for me feels so good.” When I opened it, I saw AI building a scientific diagram stroke by stroke on a Draw.io canvas—arrows, sections, and text were all editable. It was seriously satisfying to watch.
But not everyone has Codex installed or finds it convenient.
Later, I tracked down the tool behind it: drawio-scientific-illustrator, created on GitHub by icebird1998. The original version is a Codex plugin backed by two MCP servers. WorkBuddy already supports MCP, so why install Codex? Just connect it directly. This article is a practical guide based on my experience after porting it to WorkBuddy.
Here’s a potential pitfall that not everyone will encounter. The first time I started Draw.io in a sandbox environment, the canvas failed to load and reported GPU crashed and Target crashed. I later found that the GPU subprocess had crashed inside the sandbox, preventing the debugging port from starting. Adding --no-sandbox to the startup parameters fixed it. I’ll leave this as a fallback option later; you probably won’t run into it.
How it works
It relies on two MCP servers, both running locally on your computer. They directly call Draw.io’s own diagram model interface through a local channel bound only to 127.0.0.1:
drawio-live — opens a Draw.io window that you can see. AI adds shapes, connects lines, takes screenshots, and saves the file on the canvas in real time. You can watch it draw stroke by stroke.
drawio-file-utils — doesn’t open a window. It directly generates and validates .drawio files and can also export PNG, SVG, PDF, and JPG. If you just want to produce an image quickly, this is all you need.
One detail is especially important, and it’s the biggest difference from “one-click image generation”: it doesn’t simulate mouse and keyboard input, nor does it first output XML for Draw.io to open. The diagram is genuinely drawn on the canvas one stroke at a time. Only after the drawing is complete is the current canvas saved as your .drawio file. So what you receive isn’t a static image—it’s an editable project file.
What is MCP? In one sentence: it’s a protocol that lets AI operate software on your local computer. Once connected, you talk to the AI, and it operates Draw.io.
Which type are you?
Complete beginner who just wants an editable diagram quickly: Use
drawio-file-utils. Tell the AI, “Help me draw an experimental workflow diagram,” and it will give you a.drawiofile and a PNG directly, without even opening the Draw.io window.Somewhat familiar and want to watch or interrupt AI as it draws: Use
drawio-live. You can watch the canvas as it draws step by step and say, “Move this line over here,” whenever something doesn’t look right.Supervising students or projects and concerned about quality or data leaving your machine: Don’t worry. The official security boundaries are clearly defined: the debugging port binds only to
127.0.0.1, it connects only to Draw.io/diagrams.net pages, it doesn’t use system-level mouse or keyboard controls, and there is no telemetry or cloud service. The diagram stays on your machine from start to finish and cannot leave it. If startup fails, adding--no-sandboxonly allows Draw.io to run locally inside the sandbox; it has nothing to do with data security.
It only takes two steps to connect
First, make sure you have the Draw.io desktop app installed on your computer.
Releases · jgraph/drawio-desktop
Find the version that matches your computer.
Then open WorkBuddy’s MCP service management and tell the AI:
Install the drawio-live and drawio-file-utils MCP services for me.
It will download and configure them automatically. Next, you’ll see two additional services under “My MCP,” both marked “Awaiting trust confirmation”—just like in the screenshot. Click Trust on the right for each one. Once both are confirmed, restart the conversation and you’re ready to go.
That’s it: install Draw.io, then click Trust twice in WorkBuddy.
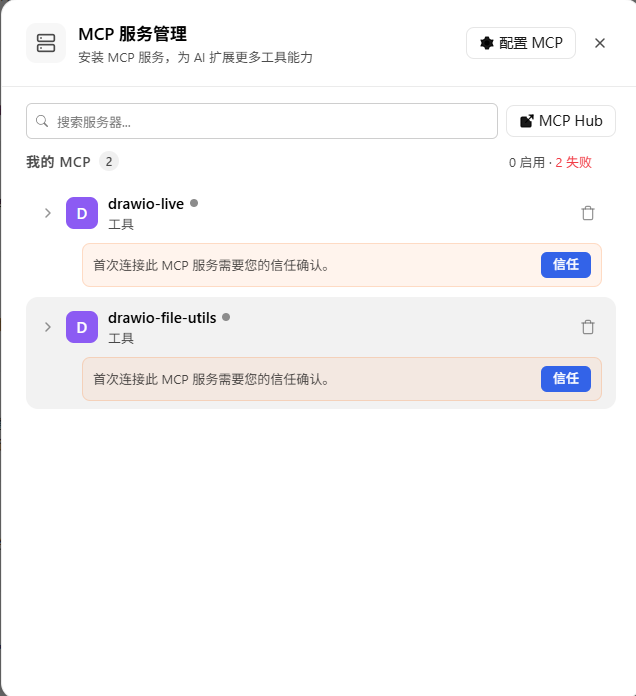
Some older tutorials tell you to clone the repository, edit mcp.json, and add a sandbox patch. That’s the old way. WorkBuddy can now understand the instruction directly and handle the remaining tedious work itself.
If Draw.io fails to start after installation, the GPU subprocess probably crashed inside the sandbox (with
GPU crashed/Target crashed). Add--no-sandboxto the startup parameters and it should work. Also make sureDRAWIO_PATHis correct (usuallyC:\Program Files\draw.io\draw.io.exe, not the one under AppData); an incorrect path will result inENOENT. I encountered both issues during installation—just apply these fixes. They won’t affect the two-step process above.
How to use it
The most common workflow is to provide a reference image and have it redraw the image as an editable diagram. Upload a PNG, JPEG, or SVG, or a page exported from a PDF, then tell the AI, “Redraw this as Draw.io elements.” It will open the canvas and build the diagram based on the reference. Scientific illustrations and reference diagrams with arrows and sections work especially well.
This is the instruction I usually use (just say it directly in WorkBuddy—there’s no need to mention Codex or any plugin names):
Use drawio-live to start Draw.io and redraw this reference image. Draw it step by step at 100ms intervals, with editable text and connectors. When finished, save it as a .drawio file and export a 2000px PNG.
There’s also a convenient way to export—use Draw.io’s built-in command line directly to avoid occasional path issues with MCP exports:
"C:/Program Files/draw.io/draw.io.exe" "input.drawio" --export --format png --width 2000 --output "output.png"
The typical workflow can be summed up in one line: upload the reference image → start the canvas → watch it draw step by step → review and fine-tune → save → export.
To be honest, it has limitations. The live tool currently works mainly with Draw.io’s own diagram elements. Microscopy photos, heat maps, and complex data visualizations still require specialized tools, or need to be added manually afterward. The fidelity also depends on how clear your reference image is. I’m mentioning this upfront so you don’t try it with a blurry image and then blame me.
What I actually drew with it
Talking about it isn’t enough, so I used it to draw three diagrams that same day. All were .drawio source files, with editable text and connectors, and were exported as 2000px PNGs:
Data engineering diagram: 28 shapes + 12 connectors. At the center was a smart big-data center, connected outward to a data-sharing platform, external interactions such as public security, culture and tourism, and meteorology, and an integrated data infrastructure platform.
Five-level capabilities + dual execution-platform architecture: data sensing → predictive assessment → flexible-load mining → collaborative decision-making → execution and distribution, with two execution platforms below (computing-network and power-grid/energy).
Computing-power–energy collaborative scheduling architecture: 64 shapes + 13 connectors, completed in 78 steps. The collaborative decision-making layer, flexible-load mining layer, and data-sensing layer were laid out one by one.
Even the most complex one, with 78 steps, completed without getting stuck—and it was still editable by double-clicking when finished.