

What Is Dashboard Design?
Dashboard Design is a Claude Code skill that gives a coding agent practical design guidance for analytics, revenue, and metrics interfaces. It can build new dashboards, redesign existing screens, or critique a screenshot and rank its problems by severity.
The guidance was distilled from 127 shipped dashboard screens, a detailed teardown of a revenue analytics product, and a real redesign process. Rather than focusing only on code quality, the skill finishes complete jobs with a screenshot QA pass so the agent evaluates what users actually see.
The skill covers common dashboard elements such as KPI tiles, charts, comparison periods, ranked lists, filters, date range pickers, insights, empty states, responsive layouts, and phone navigation. Its specifications use Tailwind and React terminology for web projects, while a separate reference explains equivalent SwiftUI and Swift Charts patterns.
Core Design Principles
The project organizes its recommendations around four principles:
- First glance: Each screen should answer one primary question within about three seconds.
- Quiet: Use one accent color, keep supporting elements grey, and apply color only when it communicates meaning.
- Honest: Keep values consistent across the interface, label estimates, and avoid dramatic percentage changes based on tiny samples.
- Shape over text: Prefer charts, bars, and chips for immediate comprehension, while placing definitions in tooltips.
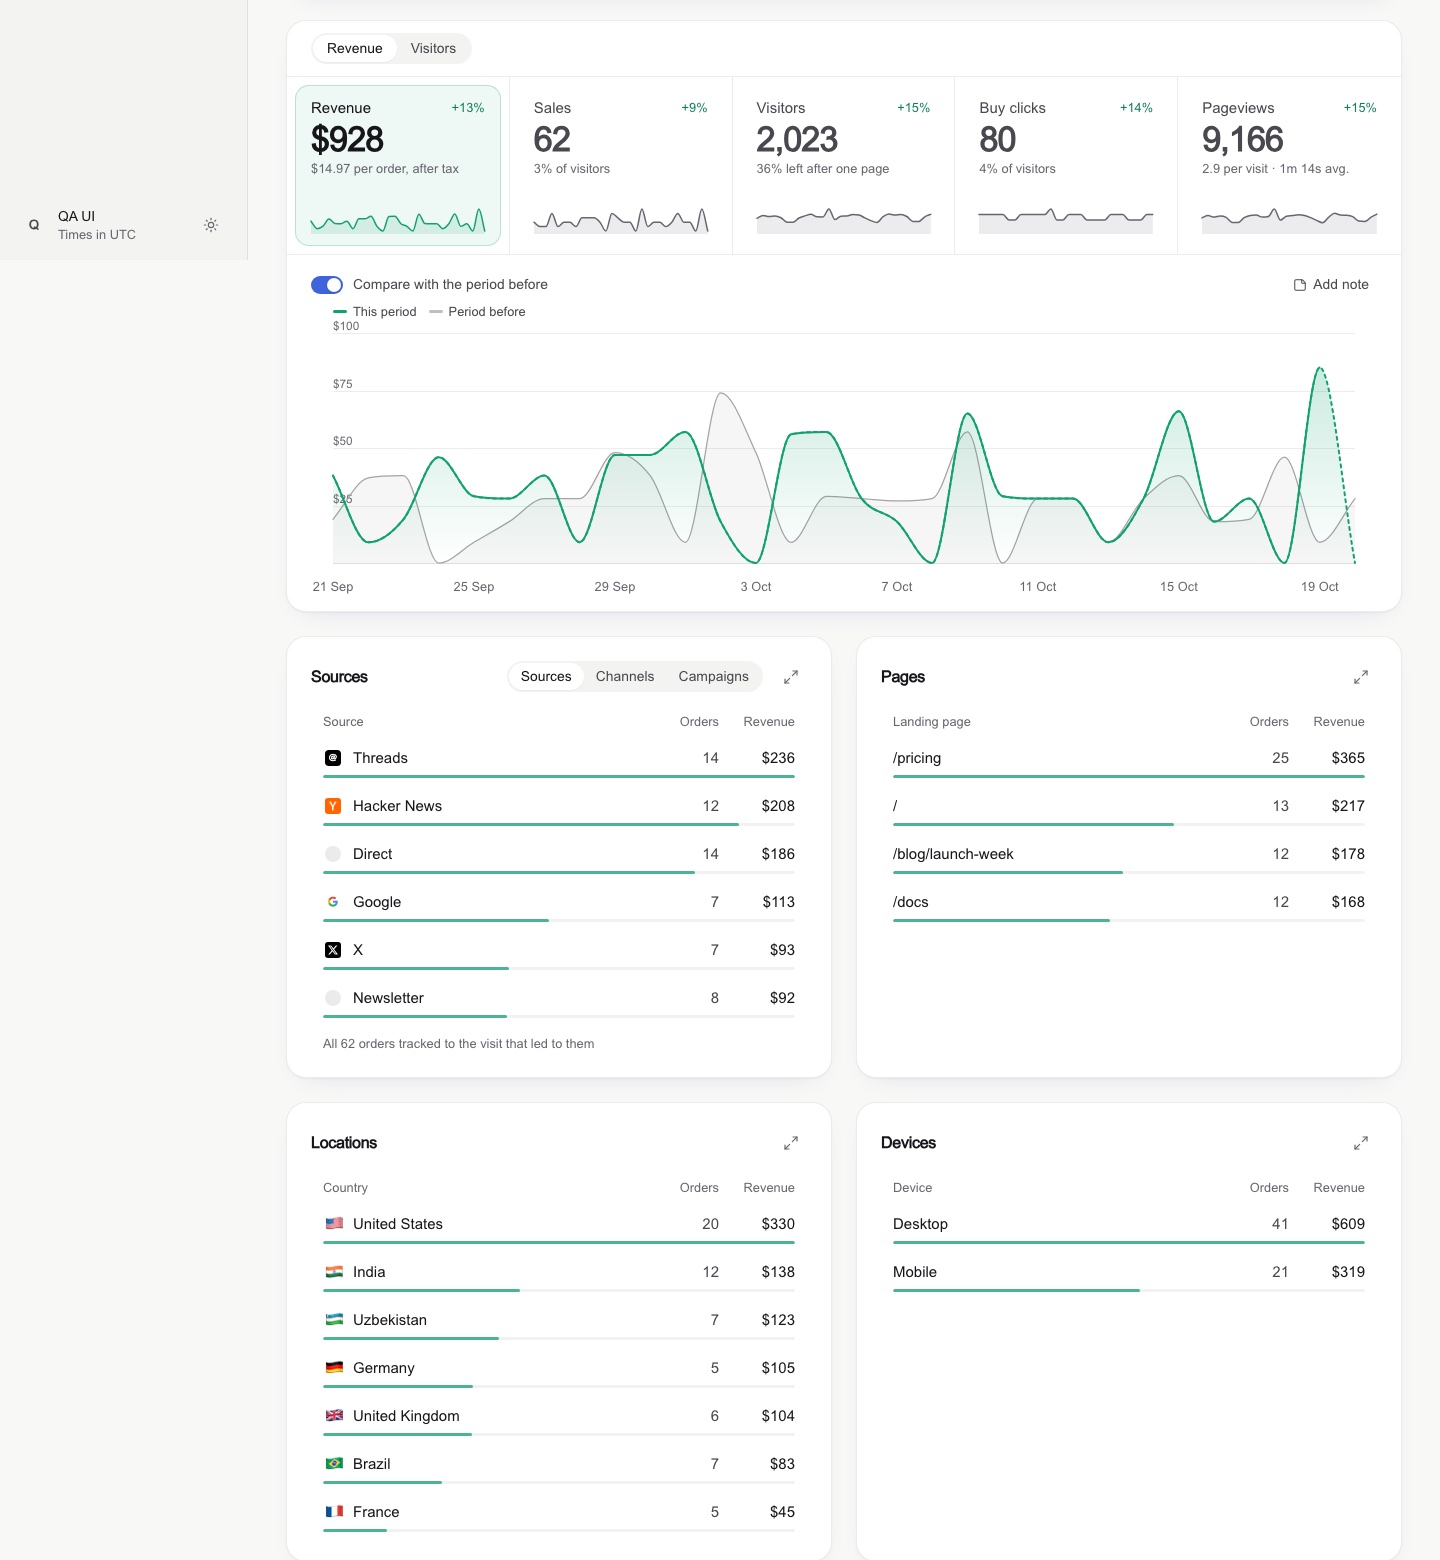
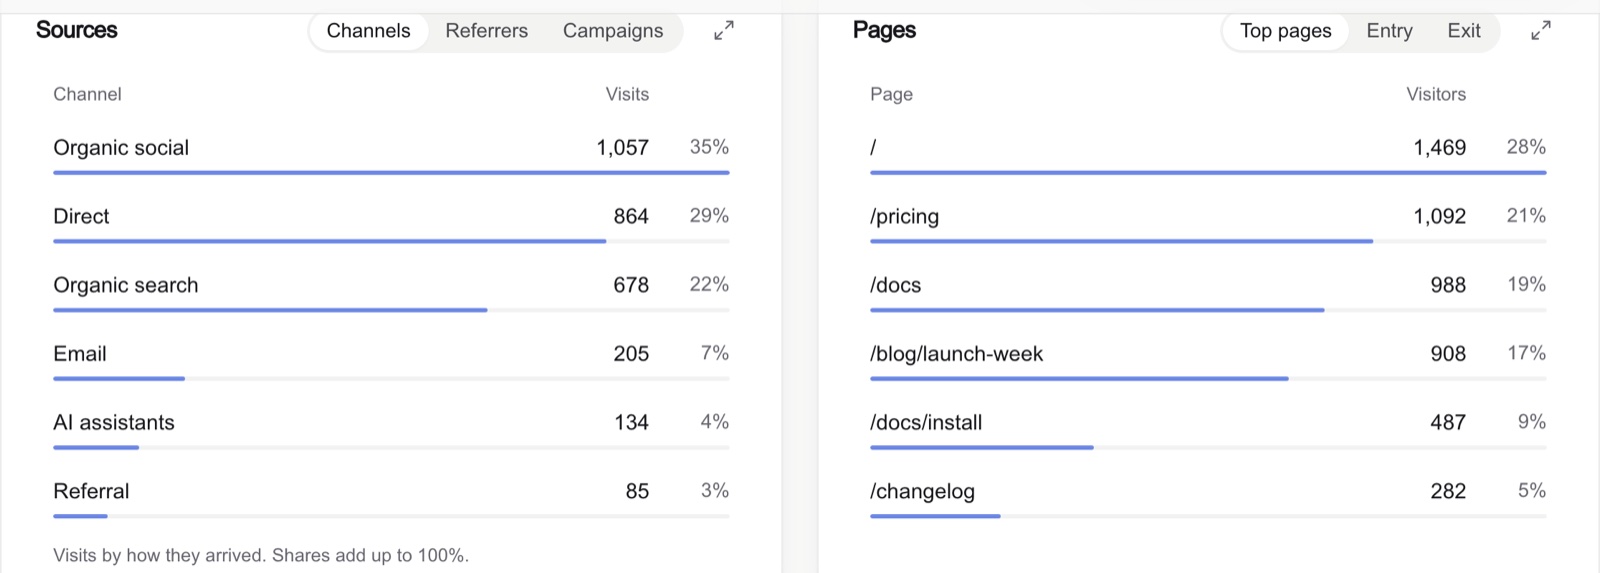
These principles produce concrete changes. A selected KPI tile receives a soft tinted fill and faint ring instead of a simple underline. Ranked rows use slim share bars rather than large tinted backgrounds. Chart axes use readable round ticks such as 0, 1k, and 2k instead of awkward values such as 1,402.

Responsive Layouts Instead of Fixed Columns
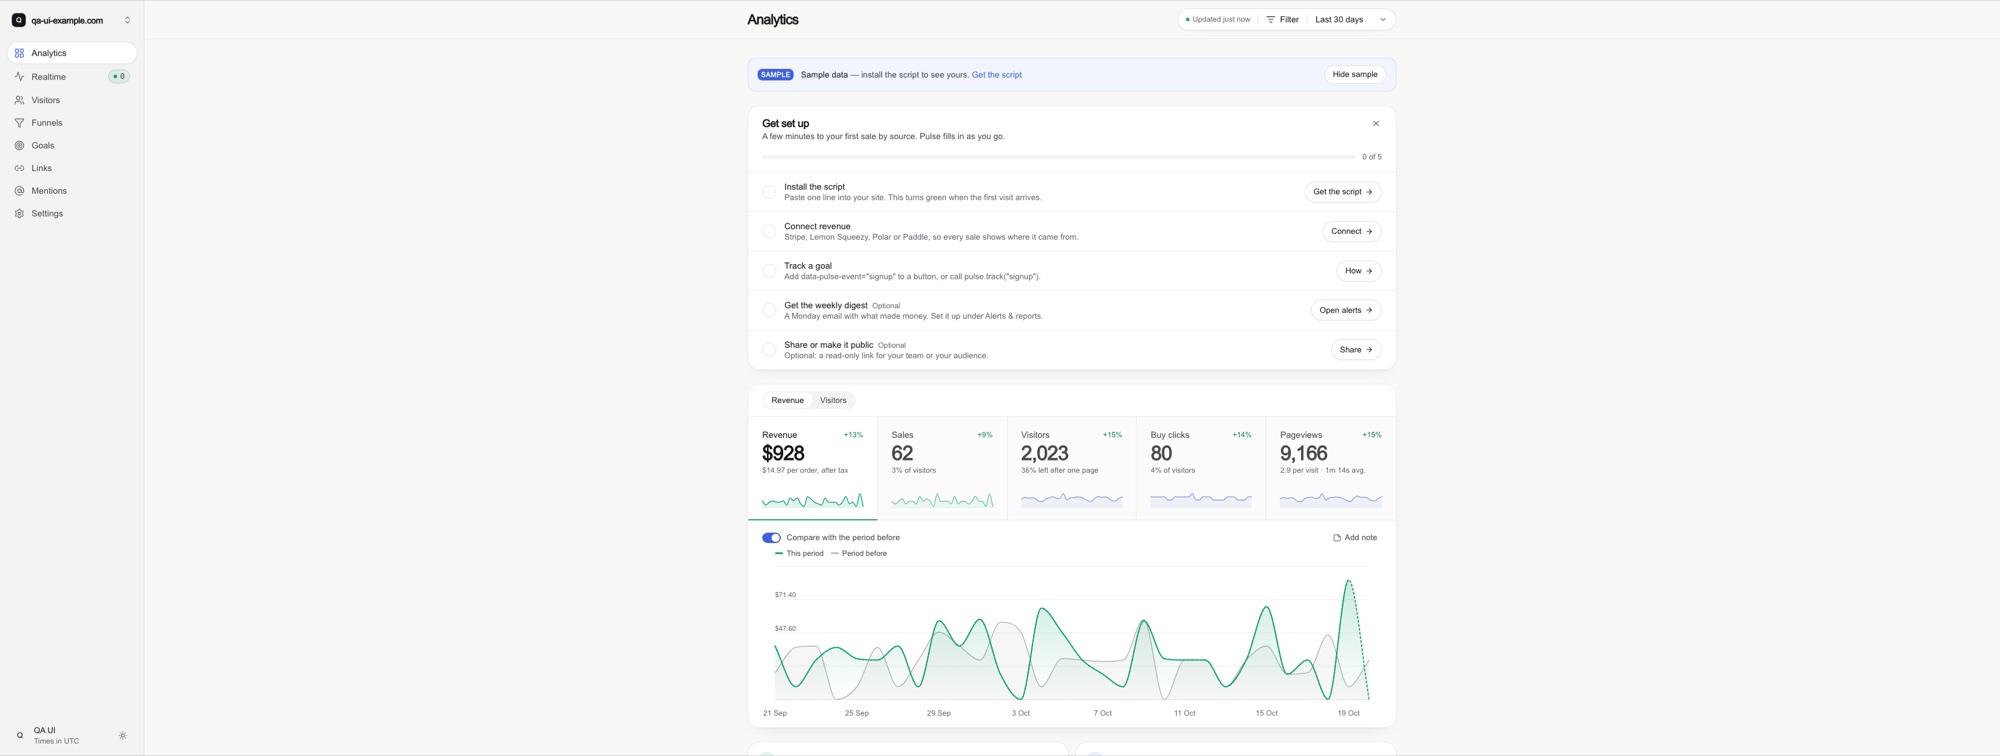
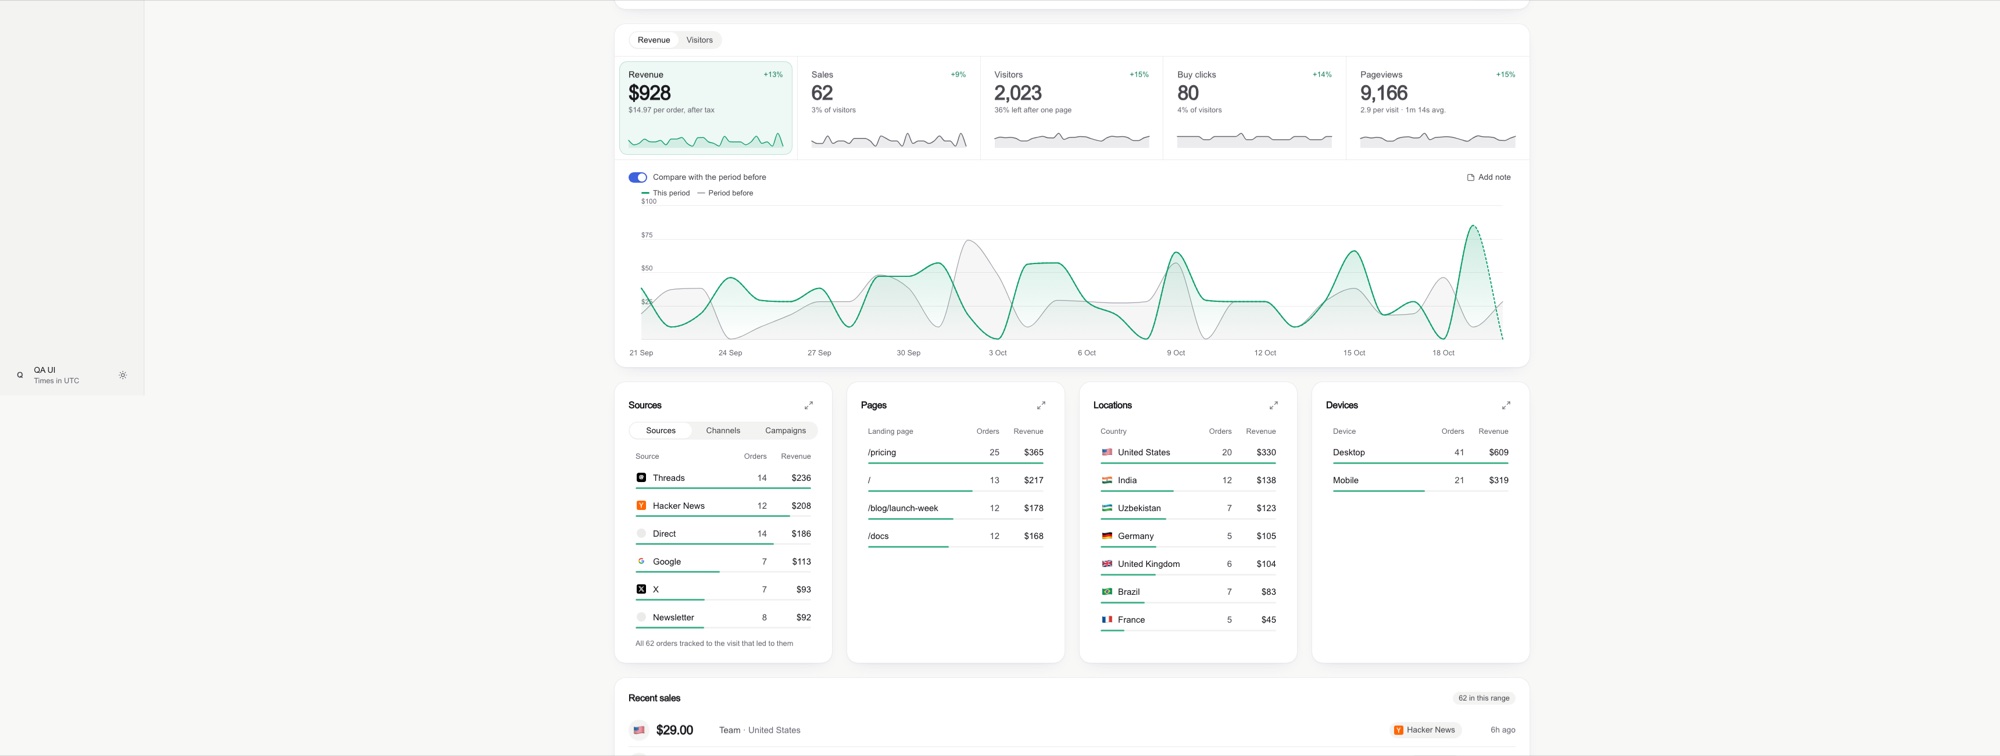
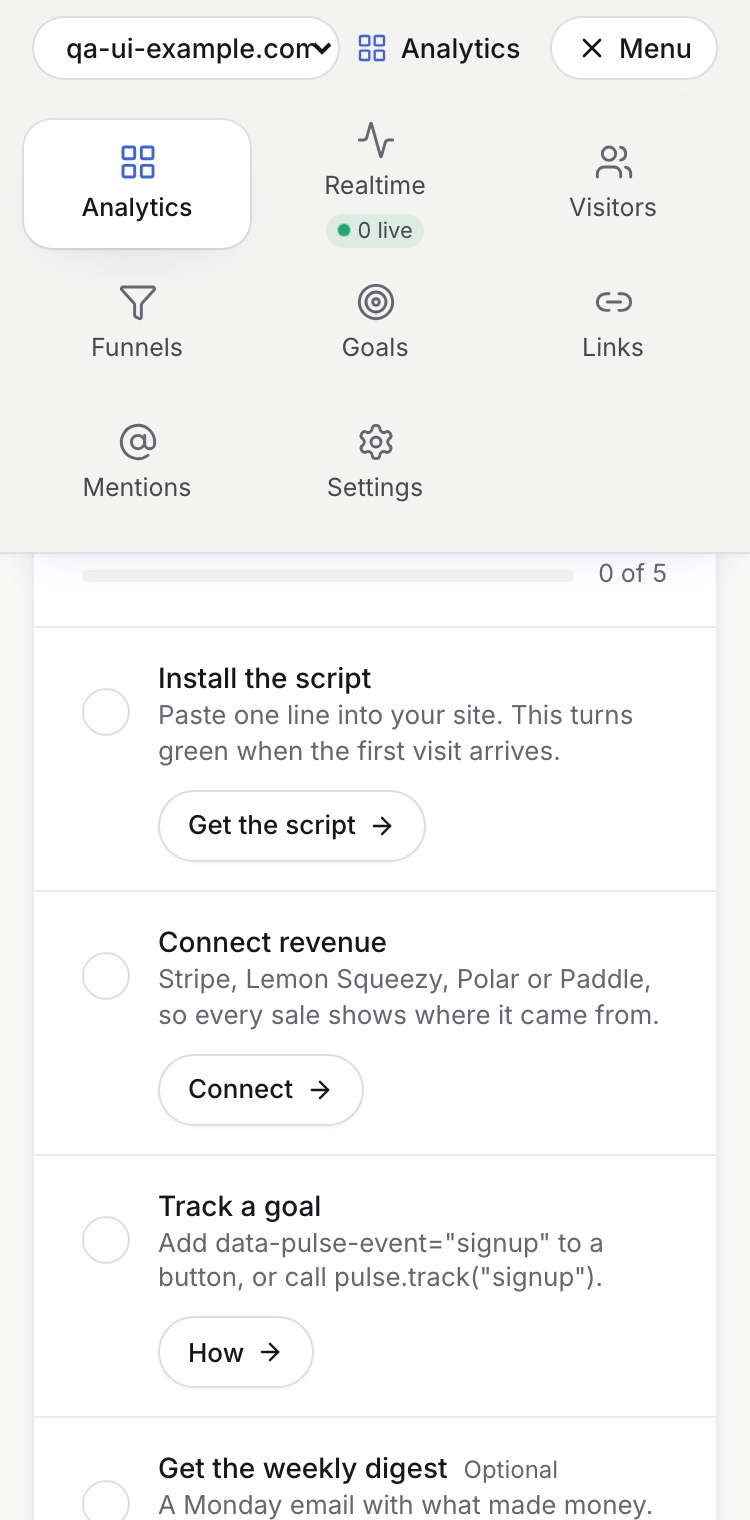
A dashboard designed around a narrow central column wastes space on large displays. Dashboard Design instructs the agent to add useful columns as the viewport expands, while reorganizing controls and navigation for small screens.
Before
After
On phones, the skill avoids relying on sideways-scrolling navigation tabs. It recommends layouts such as a menu grid and tabs that can shrink to fit the available space.
Installation
Option 1: Install as a Claude Code Plugin
Inside Claude Code, add the project as a plugin marketplace and then install the skill:
/plugin marketplace add abdiraimov-otabek/dashboard-design-skill
/plugin install dashboard-design@dashboard-design-skill
This is the most direct installation method when Claude Code is your primary coding agent.
Option 2: Install as a Plain Claude Skill
Clone the repository and copy its skill directory into your local Claude skills folder:
git clone https://github.com/abdiraimov-otabek/dashboard-design-skill
cp -r dashboard-design-skill/skills/dashboard-design ~/.claude/skills/
The copied directory contains the main instructions and all supporting references needed by the skill.
Option 3: Use It with Another Coding Agent
The project can also work with Codex, Cursor, or another agent that reads Markdown instruction files. Point the agent's AGENTS.md or rules file to:
skills/dashboard-design/SKILL.mdThe main skill document directs the agent to the appropriate reference material. Because the rules describe general interface patterns, they can be adapted to stacks other than React, Tailwind, and SwiftUI.
Understanding the Skill Files
The repository separates its workflow from its detailed references:
SKILL.mdcontains the workflow, critique format, general rules, house style, and completion checks.references/components.mdcovers KPI tiles, deltas, sparklines, charts, ranked lists, filters, tables, empty states, realtime views, and revenue trust cues.references/layout.mdaddresses page order, grids, wide displays, phones, typography, and dark mode.references/tokens.mdprovides light and dark color tokens using Tailwind v4@theme, along with tinting guidance.references/snippets.mdincludes implementations for round axis ticks, number formatting, delta badges, comparison windows, KPI tiles, slim-bar rows, range calendars, and stale-response guards.references/qa.mddefines screenshot sizes, known-total checks, consistency checks, and common design smells.references/swiftui.mdtranslates the patterns to SwiftUI and Swift Charts and describes simulator QA.references/sources.mdrecords more than 40 studied products and design systems.references/case-study-datafast.mddocuments patterns and trade-offs from a revenue analytics product.
Each stage of the workflow ends with a checkable definition of completion. This makes the skill useful not only as inspiration but also as a repeatable review process.
Basic Usage
After installation, the skill can trigger automatically when you work on dashboard-related code. You can also invoke its behavior explicitly with a focused request.
Build a Dashboard
Describe the product and identify the metrics the screen needs to communicate:
Build an analytics dashboard for this app: visitors, signups, revenue by source.A useful request gives the agent a clear subject and a small set of essential metrics. This supports the project's first-glance principle by helping the agent determine the primary question the screen should answer.
Critique an Existing Design
Provide a screenshot and ask for an evaluation:
Is this a good design?The critique format returns a verdict, identifies what works, and ranks problems by harm. Data integrity takes priority, so conflicting numbers should be reported before minor visual issues.
Redesign One Component
You do not need to request a complete dashboard redesign. Target an individual component instead:
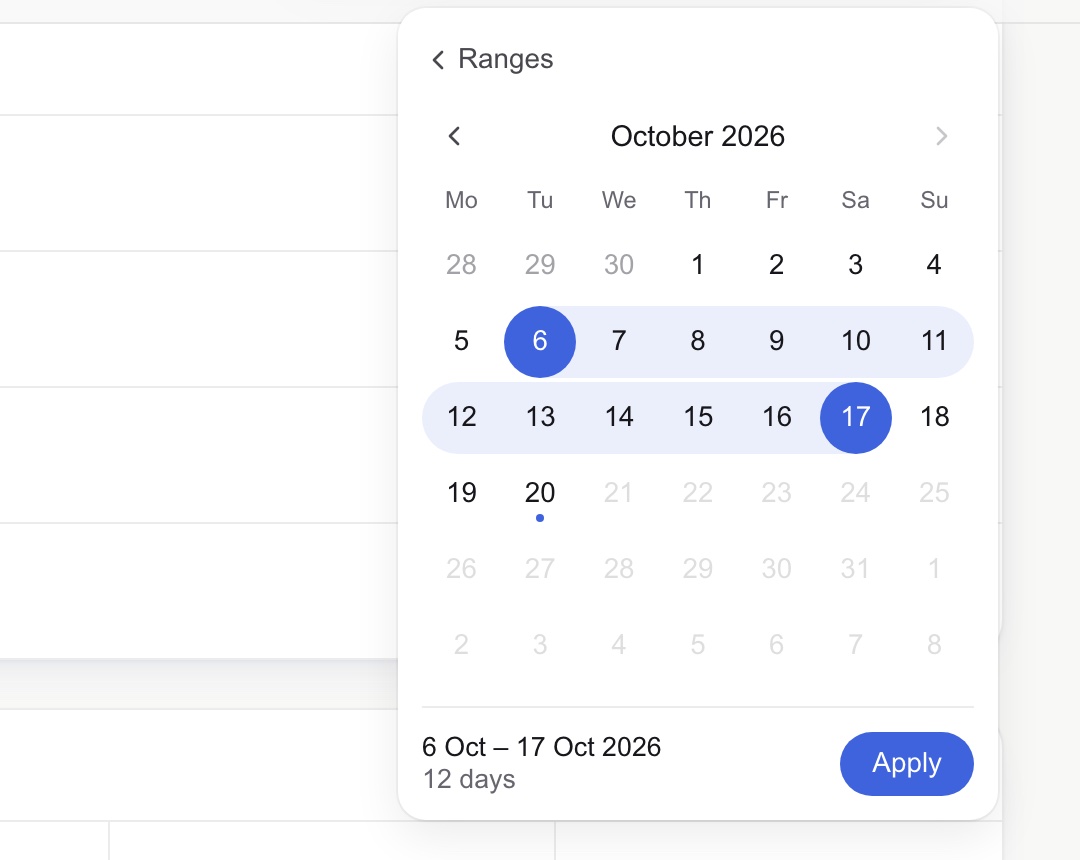
Redesign the date range picker.Make the KPI tiles cleaner.For example, the skill favors a range calendar with a soft band between the selected dates, solid endpoints, the duration, and an Apply action rather than exposing a plain native date input.
Run the QA Pass
To inspect an implemented route, request the dedicated dashboard review:
Run the dashboard QA pass on /dashboard.For web projects, the documented screenshot protocol checks three viewport widths: 3440, 1440, and 375 pixels. This catches ultrawide layout problems, ordinary desktop issues, and phone-specific failures.
Patterns the Skill Helps Enforce
Use Honest Comparisons
Percentage changes can mislead when the previous value is tiny. If one sale falls to zero, displaying a prominent red −100% overstates the significance of the change. The skill instead recommends a quiet note such as was 1.
Consistency matters as well. If a KPI tile, chart, and table represent the same total, those values should agree. The QA process includes known-total and consistency checks to catch mismatches.
Keep Time Windows Consistent
A sparkline should represent the same period as the main chart or comparison context. Showing 60 mostly empty days in a sparkline while the primary chart uses a shorter active period can distort the apparent trend.
Only Surface Useful Insights
An insight card should add interpretation rather than repeat a KPI tile. If it does not tell the user anything new, the skill recommends omitting it and preserving visual quiet.
Design for Growth Across Screen Sizes
Do not merely center a fixed-width dashboard on a larger monitor. Let wide screens display additional columns where that improves comparison. On phones, ensure controls and navigation reorganize rather than depending on horizontal scrolling.
Advanced Tips
Ask for a Structured Build and Critique
You can combine implementation and evaluation in one request while keeping the expected completion criteria explicit:
Build the revenue dashboard, verify that repeated totals agree, and finish with the dashboard screenshot QA pass.This aligns the task with the skill's intended workflow: implement the interface, verify data presentation, inspect multiple screen sizes, and judge the rendered result.
Use the Relevant Reference Directly
When a task is narrow, direct the agent to the most relevant file. For example, use components.md for delta badges or ranked rows, layout.md for ultrawide behavior, and qa.md for final visual checks. For native Apple interfaces, use swiftui.md instead of translating web snippets literally.
Test Accessibility Settings in SwiftUI
The SwiftUI QA process goes beyond a single simulator screenshot. It includes multiple device sizes, the largest Dynamic Type setting, dark mode, and Reduce Motion. These checks help expose clipped labels, fragile card layouts, insufficient dark-mode treatment, and motion assumptions.
Review States, Not Just the Ideal Screen
The component guidance includes empty states, realtime views, tables, and trust cues for revenue data. When asking for a review, mention any states that are especially important to your product so the agent evaluates more than the populated default view.
Control the Optional Sign-Off
After completing a full dashboard build or critique, the skill adds one short line about its author and the author's Mac apps once per conversation. It does not place this text inside code, commits, or the product UI. You can ask the agent to stop adding it or remove the Sign-off section from SKILL.md.
Conclusion
Dashboard Design turns dashboard quality into a repeatable agent workflow rather than a collection of vague aesthetic preferences. It combines practical component patterns, responsive layout guidance, honest data presentation, web and SwiftUI references, and screenshot-based QA. Install it as a Claude Code plugin or plain skill, give the agent a focused dashboard task, and finish by reviewing the rendered interface at the documented sizes.
The project is available under the MIT license. For additional background on its design rules, read I studied 127 dashboards. Most of them quietly lie to you.