
What tokentab does
tokentab is a local reporting tool for understanding how coding assistants consume tokens and accumulate estimated costs. It reads session logs that supported tools already store on your computer, then groups usage by model, provider, project, day, and inferred type of activity.
No account or API key is required. Processing stays on your machine, and tokentab does not upload session information or contact pricing services.
Supported tools and log locations
tokentab currently includes working parsers for three tools:
- Claude Code:
~/.claude/projects/**/*.jsonl - Codex:
~/.codex/sessions/**/rollout-*.jsonl - Gemini CLI:
~/.gemini/tmp/**/session-*.json
A provider slot for Cursor exists, but its parser is not finished. If one of the supported tools is not installed, tokentab simply skips it. Reports therefore include only tools whose logs are available on your machine.
Key features
- Reads token counts directly from existing local session logs.
- Estimates costs using a local, hand-maintained pricing table.
- Groups data by provider, model, project, date, and activity.
- Supports daily, monthly, all-time, and custom date ranges.
- Produces terminal tables or machine-readable JSON.
- Provides a browser dashboard that binds only to localhost.
- Removes terminal color automatically when output is piped.
- Uses no web framework; the dashboard runs on Python's standard-library HTTP server.
The only third-party dependency is Rich, which renders the terminal tables. Parsing, JSON processing, and the local web server use Python's standard library.
Install tokentab
Standard installation
Clone the repository, enter its directory, and install the package into your active Python environment:
git clone https://github.com/damejan80/tokentab
cd tokentab
pip install .
python cli.py
The installation adds a tokentab command to your path. Afterward, you can run the installed command directly:
tokentabEditable source installation
If you plan to inspect or modify the code, install it in editable mode:
git clone https://github.com/damejan80/tokentab
cd tokentab
pip install -e .
tokentab
Editable installation keeps the command connected to your working copy, so local code changes take effect without reinstalling the package.
Run your first report
From the repository directory, run the CLI without options:
python cli.pyThe default report covers the last seven days across every detected provider and project. If you installed the command, the equivalent invocation is:
tokentabBecause tokentab reads the providers' existing log directories, there is no account setup or credential configuration. If no supported logs exist, there is simply no corresponding usage to include.
Filter usage by time
Today's activity
python cli.py -todayThe current calendar month
python cli.py -monthAll available history
python cli.py -p allA specific date window
python cli.py --from 2026-06-01 --to 2026-06-15Custom windows are useful when you want to match usage to a sprint, billing period, experiment, or other defined interval.
Filter by provider or project
To show only Claude usage, pass the provider filter:
python cli.py --provider claudeTo focus on one project, use its project name:
python cli.py --project myappThese filters help separate the cost of a particular codebase or tool from your overall activity.
Export machine-readable JSON
Use --json when another program needs to consume the report:
python cli.py --jsonFor example, if jq is installed, pipe the JSON into it for formatting or further processing:
python cli.py --json | jq .tokentab automatically removes terminal color when its normal output is piped, making it easier to paste reports into pull requests, chat messages, files, or other commands without ANSI escape codes.
Use the local web dashboard
Start the browser interface with:
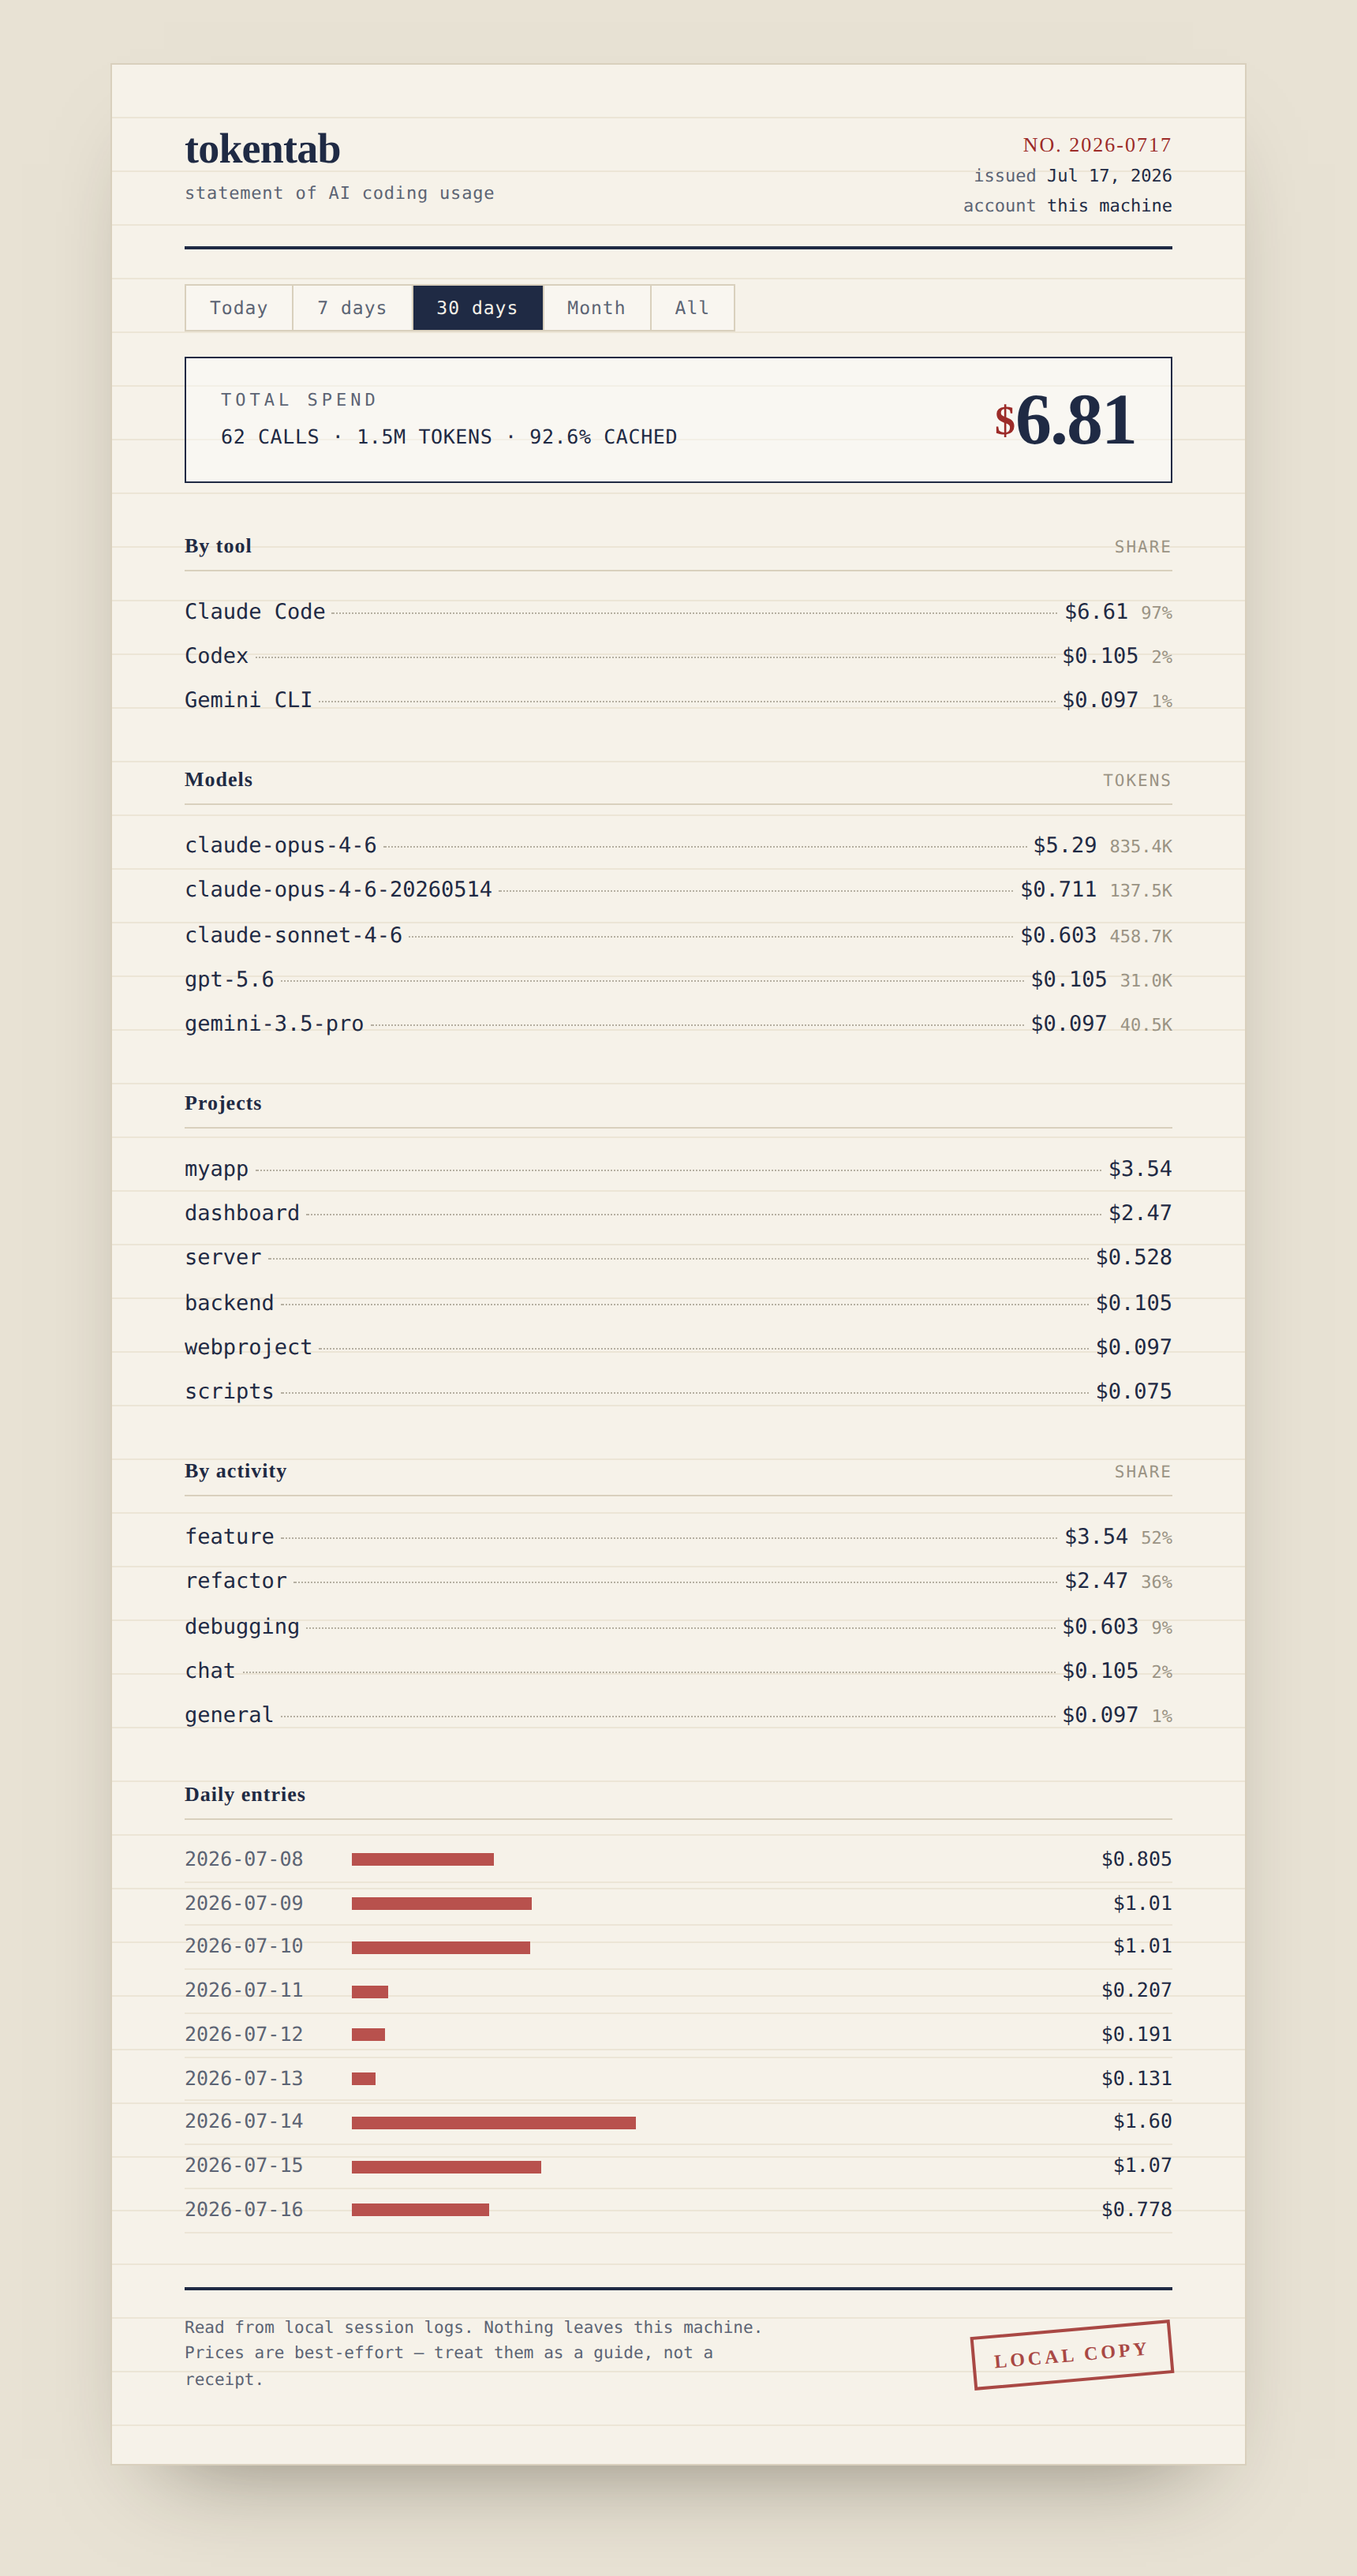
python cli.py -webtokentab opens http://localhost:4747 and presents the data like a monthly statement, with the total at the top and itemized details below.
The dashboard reads logs from disk for every request rather than caching results, so newly recorded sessions can appear without maintaining a separate database. It binds only to localhost and does not upload data. It also avoids external font services, allowing the interface to work while the network is disconnected.
To choose another port, use --port. To start the server without automatically opening a browser, add --no-open:
python cli.py -web --port 8080 --no-openUnderstand token and cost calculations
Token counts
Token totals come directly from the supported tools' logs rather than being estimated from text. tokentab also accounts for differences in cache reporting. Claude records cache reads and writes separately, while Gemini reports input that includes cached tokens. tokentab removes the cached portion where necessary to avoid pricing the same tokens twice.
Model pricing
Prices are stored locally in tokentab/pricing/prices.py as dollars per million tokens. The tool intentionally uses a static table instead of requesting live prices from the network.
Model matching is fuzzy, so a dated model identifier such as claude-opus-4-6-20260514 can match the more general claude-opus-4-6 entry. If a model appears with a cost of $0.00, its name probably did not match the table. The CLI reports this condition rather than silently assuming that the model is free.
Pricing is best-effort. Update the local table when vendors change prices or introduce model names that are not yet recognized.
Activity categories
Activity labels such as coding, debugging, refactoring, testing, chat, and exploring are inferred from the tools used and the wording of the first message in a session. This classification is deterministic and does not call another AI model.
Treat activity labels as useful hints rather than definitive judgments. The labels help reveal broad patterns, but only you know the full context of the work.
Interpret the report
- Consistent cache hit rates below about 80%: Your context may be changing frequently, or caching may not be enabled. A single unusual session is less meaningful than a pattern lasting several weeks.
- An expensive model dominating many small calls: The report may reveal that a large model is handling frequent, limited tasks. tokentab shows the pattern so you can investigate whether that usage is intentional.
- Large chat or exploring categories: Much of the recorded activity involved discussion or reading rather than editing. This may be appropriate, but it can also highlight sessions that wandered.
These patterns are starting points for investigation, not conclusions. Compare the report with what you were actually doing during the relevant sessions.
Advanced tip: add another provider
Every provider is implemented as a module under tokentab/providers/. A provider exposes a collect() function that returns a flat list of UsageRecord objects. The shared record structure is defined in tokentab/types.py.
- Create a provider module in
tokentab/providers/. - Read and parse the provider's local session files.
- Convert each relevant usage entry into the shared
UsageRecordshape. - Return the records from
collect(). - Add the provider to
tokentab/providers/__init__.py.
Once records use the common shape, the existing pricing, grouping, CLI output, and dashboard can process them. The README recommends using the Claude parser as the simplest template and consulting the other working parsers for additional examples.
Practical usage tips
- Run the default seven-day report regularly to spot recent changes.
- Use the monthly view when reviewing broader spending patterns.
- Filter by project before investigating a specific codebase.
- Export JSON when building scripts or custom reports around tokentab data.
- Check the pricing table whenever a model is reported at
$0.00. - Use the dashboard for visual review and the CLI for automation or sharing.
Conclusion
tokentab turns local Claude Code, Codex, and Gemini CLI logs into practical token and cost reports without requiring credentials or sending data away from your computer. Start with the default seven-day CLI view, narrow the results with time, provider, and project filters, then use JSON or the localhost dashboard when you need a different presentation. The project is available under the MIT license.